

📖 Introduction: Why Candlestick Charts Matter for Every Investor
Have you ever looked at a stock chart and wondered what the red and green bars mean? Those are candlesticks, which are small but powerful tools that traders all over the world use to read price action. Learning the basics of candlestick patterns can help you make better, faster trading choices. This guide will teach you the basics of candlestick patterns using real-world examples and simple language, whether you’re just starting out or have been investing for a while and want to time your entries and exits better.
In this post, you’ll learn:
- What candlestick patterns are
- How to read them
- What common patterns mean
- How to use them with other strategies
Let’s light the path to better trading decisions! 🔥
Table of Contents
🕯️ What Is a Candlestick Pattern?
A candlestick pattern is a way to show how prices have changed over a certain amount of time. Each “candle” shows where a stock opened, closed, and how high or low it went. Traders can use these patterns to guess what will happen to prices in the future based on past data.
🟢 Fun Fact: Candlestick charts were first used by rice traders in Japan in the 1700s!
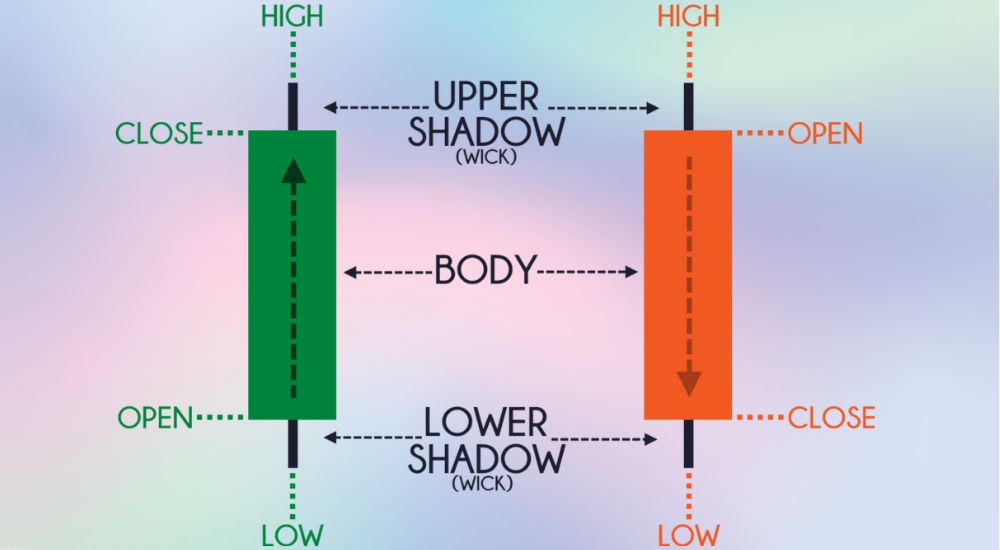
📊 Anatomy of a Candlestick 🧱
| Part | Description |
|---|---|
| Open | Price at the beginning of the time period |
| Close | Price at the end of the time period |
| High | Highest price during the time period |
| Low | Lowest price during the time period |
If the stock closed higher than it opened, the candle is green (or white). If it closed lower, the candle is red (or black).
🧠 Why Candlestick Patterns Matter
✅ Quick Decision-Making: See trend reversals or continuations instantly.
✅ Entry & Exit Signals: Know when to buy or sell.
✅ Emotional Insight: Reflects trader psychology—fear and greed in motion.
🔗 Related Read: What Is Trading? Everything You Need to Know Before You Start
🔍 Most Common Candlestick Patterns (Explained Simply)
| Pattern Name | Meaning | Market Signal |
|---|---|---|
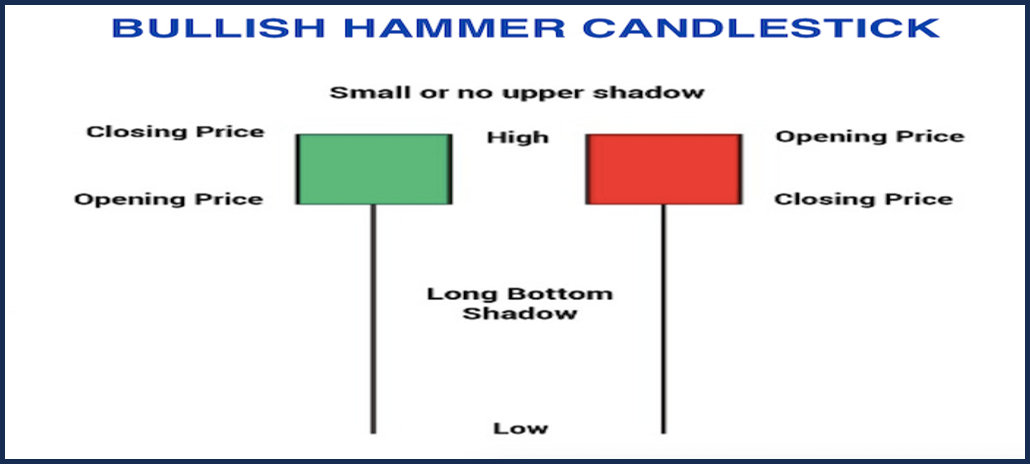
| Hammer | Reversal (Bullish) | Buy Opportunity |
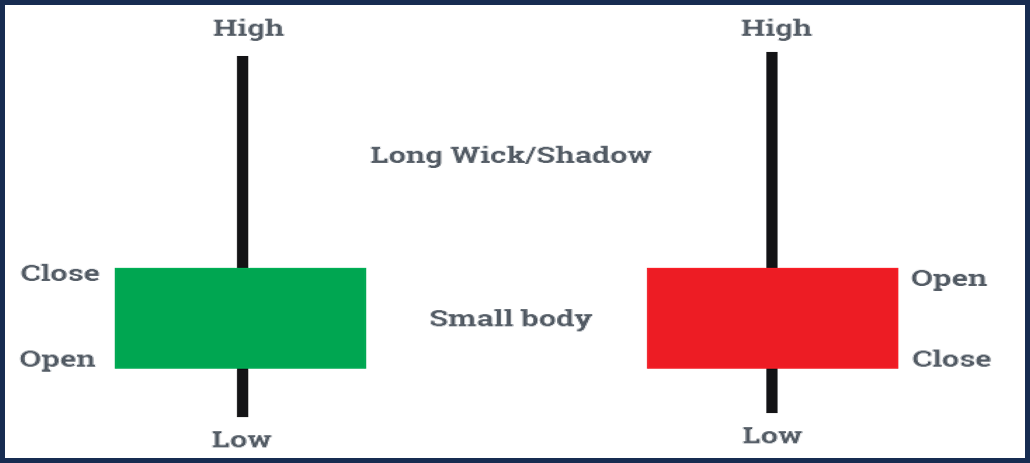
| Shooting Star | Reversal (Bearish) | Sell Warning |
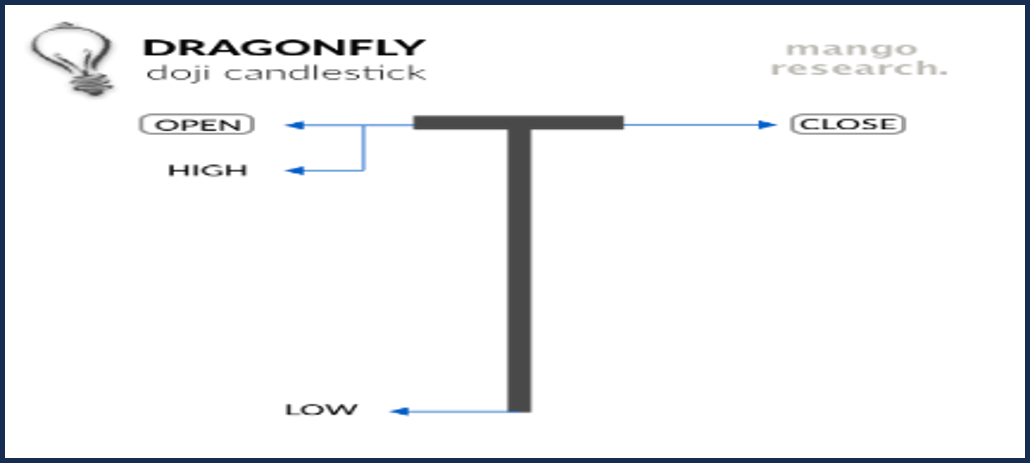
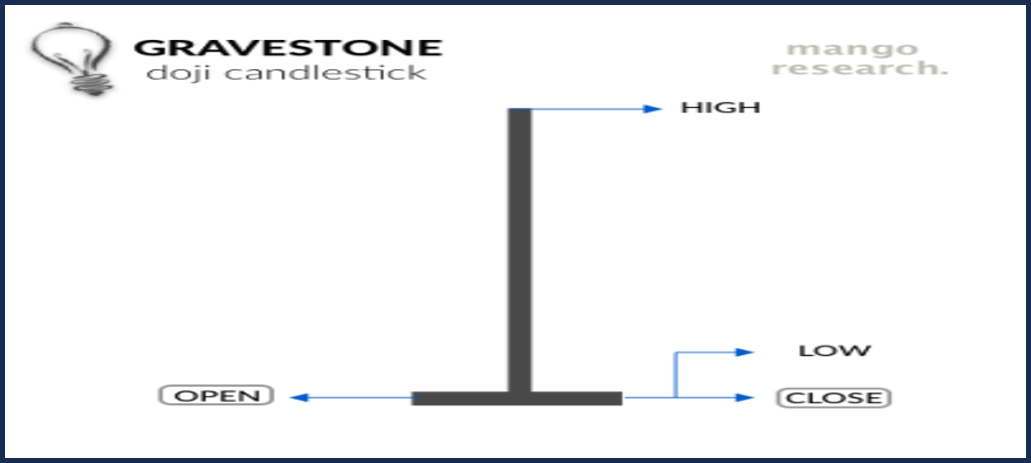
| Doji | Indecision | Wait/Watch |
| Engulfing | Strong Reversal Signal | Bullish/Bearish |
| Morning Star | Bullish Trend Reversal | Entry Point |
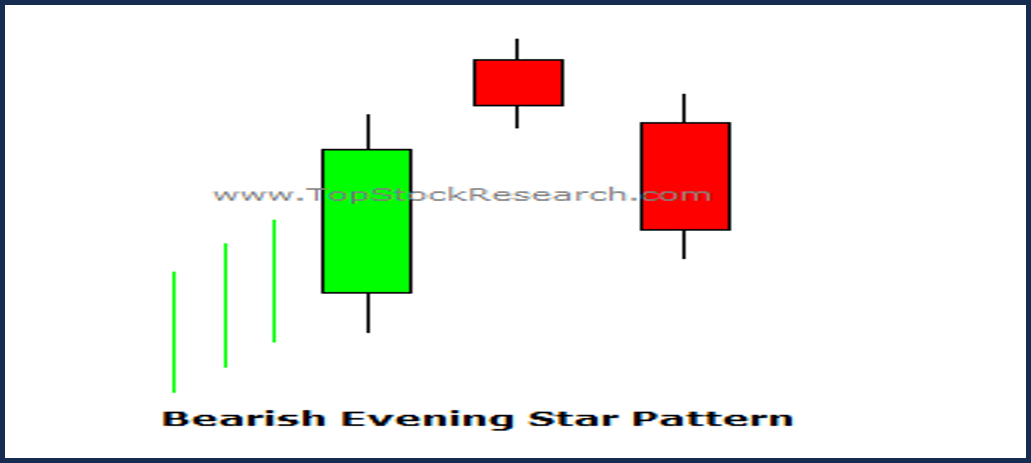
| Evening Star | Bearish Trend Reversal | Exit Point |

📈 Bullish vs Bearish Candlestick Patterns 🟢🔴
- Bullish Patterns: Indicate that prices will rise (for example, Hammer, Bullish Engulfing)
- Bearish Patterns: Indicate that prices might go down (for example, Shooting Star and Bearish Engulfing)
Depending on the situation and confirmation, these can be signals for a reversal or a continuation.
📌 How to Read and Use Candlestick Patterns
- 📍 Identify the pattern on a chart (1D, 4H, or 1W timeframes work best for beginners)
- 🔍 Check the trend direction—don’t interpret in isolation
- 🔗 Confirm with volume or technical tools (like RSI or moving averages)
- ✅ Take action if the pattern is supported by other indicators
📘 Related Guide: 10 Steps to How to Invest in Stocks—Beginner’s Guide
⚠️ Limitations & Common Mistakes to Avoid
- ❌ Relying solely on candlesticks without other indicators
- ❌ Ignoring volume confirmation
- ❌ Misreading patterns in sideways or choppy markets
- ❌ Overtrading every pattern seen
Use candlesticks as one part of your trading toolkit—not the whole strategy.
🧩 How to Combine Candlestick Patterns with Other Tools
🔗 Combine with:
- Moving Averages: Spot trend direction
- RSI: Confirm overbought/oversold levels
- MACD: Confirm momentum and reversals
📖 Also Read: Unlocking Technical Analysis: The Investor’s Toolkit
🧭 Real-World Example & Takeaways
Let’s say you see a Hammer on the Nifty 50 chart after three days of going down, and there is a lot of buying activity. This could mean that a bullish reversal is on the way. If the RSI also shows that something is oversold, the signal gets stronger.
🎯Takeaway: Don’t act without looking for patterns that confirm them.
✅ Conclusion: Start Small, Learn Consistently
Learning the basics of candlestick patterns is like learning a new language that shows you what buyers and sellers are thinking. It won’t make you rich overnight, but it can help you get better at both trading and investing.
Don’t rush; practice on charts, and use candlesticks with other tools to make strong, reliable strategies.
🧾 Disclaimer: This blog is for educational purposes only. It does not constitute investment advice or stock recommendations. Always do your own research or consult a financial advisor before investing or trading.
❓FAQs
1. Are candlestick patterns reliable?
They give you visual clues, but you should always double-check with other tools like trend or volume indicators.
2. Can I use candlesticks for long-term investing?
Yes, especially for finding good points to enter or exit a trade or when a trend might change.
3. What's the best time frame for beginners?
Use daily charts (1D) to get clearer signals and less noise.
4. Do candlestick patterns work in crypto markets?
Yes! They work for all kinds of charts, like stocks, forex, crypto, and commodities.