

Learning the language of the market is like understanding stock market trends. Knowing which way the market is going can help you make better choices, avoid common mistakes, and spot chances early, whether you’re a complete beginner or someone who’s just starting to invest. This guide makes **stock market trend analysis** easier to understand by using simple examples, real-world examples, and strategies that are easy for beginners to follow.
This blog post is for you if you’ve ever wondered why markets go up or down or how experts seem to make money by following trends. Let’s figure out what the signals are that cause market movements and how you can use them to make better investment choices.
Table of Contents
🔍 What Is a Stock Market Trend?
A stock market trend is the overall direction that stock prices go in over a certain amount of time. This could mean that the market is going up (bullish), down (bearish), or sideways (neutral).
Market sentiment, economic indicators, geopolitical events, and how investors act all have an effect on trends.
Types of Movements:
- Uptrend: Higher highs and higher lows
- Downtrend: Lower highs and lower lows
- Sideways: Prices move within a range
Understanding these patterns can help you enter or exit positions wisely.
🧭 Why Trend Analysis Matters for Beginners
Trend analysis helps you answer key questions like:
- Is now a good time to invest?
- Should I hold or exit?
- Where is the market heading?
By analyzing trends, you reduce emotional investing and align with market direction—key to long-term success.
📌 Recommended Read: What Is the Stock Market? Explain the Basics for Beginner [Updated]
📈 Types of Stock Market Trends
1. Short-Term Trends (Days to weeks)
Often driven by news or earnings.
2. Intermediate Trends (Weeks to months)
Driven by business cycles or quarterly performance.
3. Long-Term Trends (Years)
Based on macroeconomics and global financial shifts.
Each type plays a role in shaping your investing timeline.
🛠️ Tools to Identify Market Trends
- Moving Averages (MA) – Smooth out price data to reveal direction
- Trendlines – Connect highs/lows to visualize the slope
- Relative Strength Index (RSI) – Detect overbought/oversold conditions
- MACD – Shows momentum and crossovers
- Volume Analysis – Confirms trend strength
Many of these tools are available for free on platforms like TradingView or Yahoo Finance.
🧠 How to Analyze Trends Like a Pro
✅ Combine indicators for better accuracy
✅ Zoom out to understand the bigger picture
✅ Check fundamentals (like company earnings, economy)
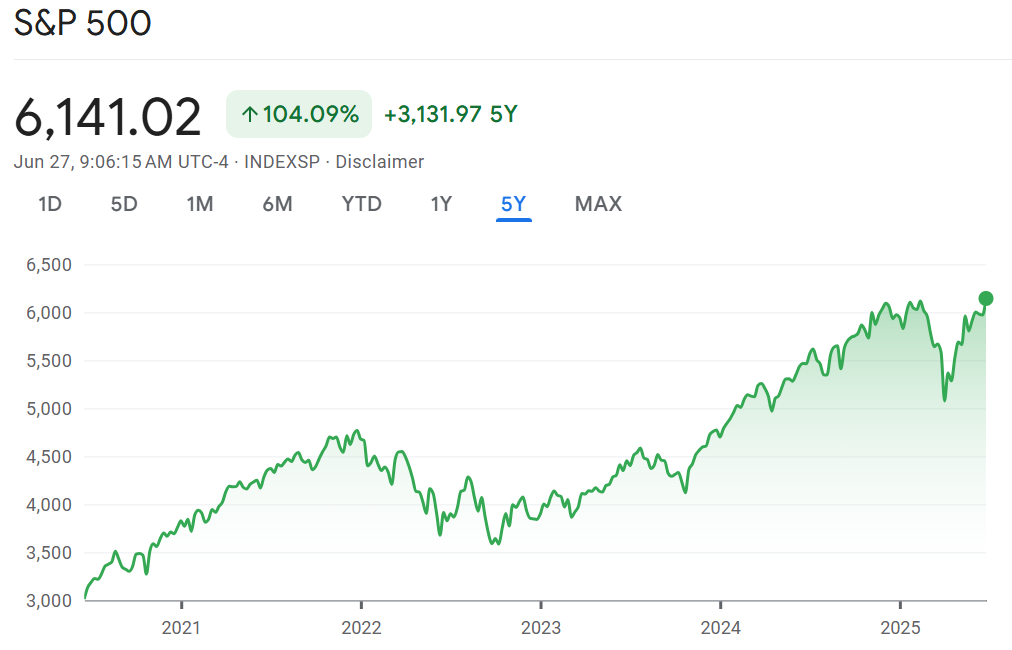
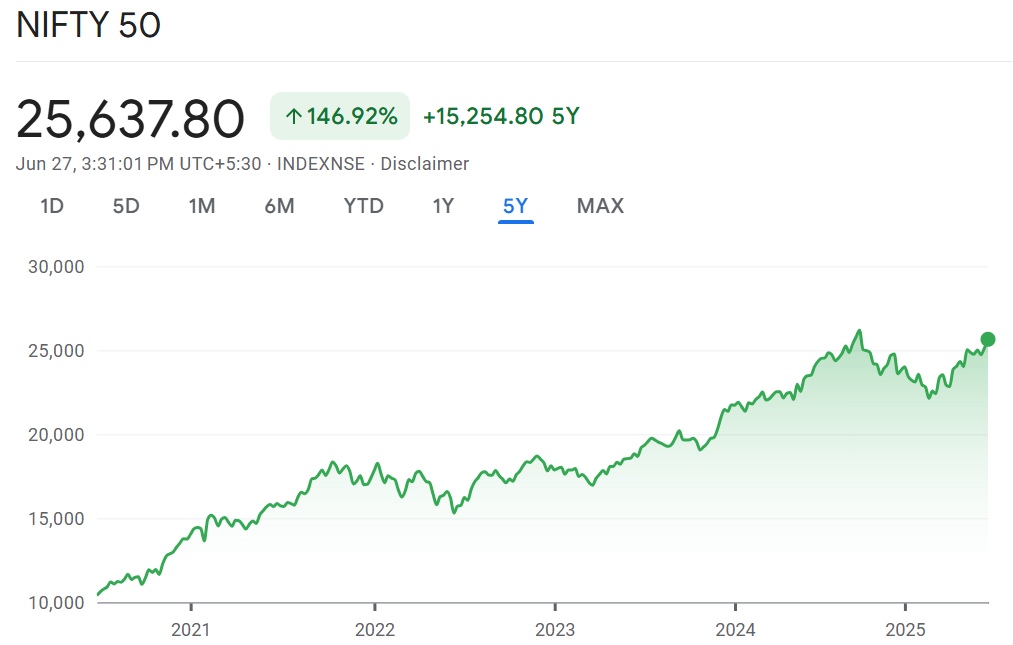
✅ Monitor global indices (e.g., S&P 500, Nifty 50)
📌 Internal Link: Mastering Stock Market Fundamentals for Long-Term Wealth
📊 Real-World Examples of Market Trends
| Year | Market | Trend | Key Driver |
|---|---|---|---|
| 2020 | S&P 500 | Uptrend | Tech & liquidity |
| 2022 | Global | Downtrend | Interest hikes |
| 2023 | India Nifty 50 | Uptrend | Retail inflows |
Understanding past market behavior helps predict future possibilities.
⚠️ Common Mistakes to Avoid in Trend Analysis
❌ Relying on one indicator alone
❌ Ignoring the broader market context
❌ Overtrading based on short trends
❌ Letting emotions override analysis
Always use data-backed strategies.
🧩 Actionable Tips for Using Trends in Investing
✨ Use stop-losses to limit risks
✨ Align investments with long-term trends
✨ Stay informed with economic and company updates
✨ Backtest strategies before committing real money
📌 Helpful Read: Paper Trading: Your Zero-Risk Path to Profits?
🏁 Conclusion
It’s not about predicting the future when you understand stock market trends; it’s about reading the signs. When you learn to spot patterns, you give yourself a strategic advantage. Begin small, stick with it, and always let the trend be your friend.
Trend analysis will help you build wealth over time or avoid costly mistakes in your investing journey.
⚠️ Disclaimer: This article is for educational purposes only and does not constitute financial advice. Always do your own research or consult a financial advisor before investing.
❓FAQs
1. How do I know if a market trend is strong?
When there is a lot of volume, momentum indicators, and market sentiment behind a trend, it is strong.
2. Can I rely solely on trend analysis?
No. For better results, use it with both fundamental and technical analysis.
3. Which time frame is best for trend analysis?
It depends on how you like to invest. Long-term investors should look at monthly trends, while traders may look at hourly or daily trends.