

Every investor and trader needs to know how stock prices change and, even more importantly, how to look at those changes. Stock price analysis gives you a solid base to make smart decisions and stay away from emotional investing, whether you’re just starting out or already trading.
We’ll talk about what stock price analysis is, the different kinds of it, how to read price charts, and how to use real-world examples to figure out patterns.
📚 New to stocks? Learn the basics of the stock market before diving deep into price analysis.
Table of Contents
What is the analysis of stock prices?
Stock Price Analysis is the process of looking at a stock’s current and past prices to make predictions about where prices will go in the future and find chances to buy or sell.
It helps you find answers to questions like
- Is this stock worth more or less than it is?
- Is it a good time to buy or sell now?
- What signs show that a trend is coming?
🧠Why Stock Price Analysis Matters
It helps you make decisions without letting your emotions get in the way. Finds trends early so you can enter and exit better Helps you see how stocks have done over time Improves your overall plan for investing
💡Tip: For better investing results, use stock price analysis along with fundamental analysis.
📈 Three Main Ways to Analyze Stock Prices
1. Technical Analysis 🔍
Looks at price patterns, volume, and chart indicators to guess where the market will go next.
What tools were used:
- Moving Averages
- RSI (Relative Strength Index)
- MACD
- Candlestick Patterns
2. Fundamental Analysis 📊
Checks out a company’s finances to find out how much it’s really worth.
Key elements:
- Earnings
- P/E Ratio
- Book Value
- Management performance
3. Sentiment Analysis 🧠
Looks at news, trends, and public opinion to figure out how investors feel.
Sources:
- People talking on social media
- Headlines in the news
- Scores for market sentiment
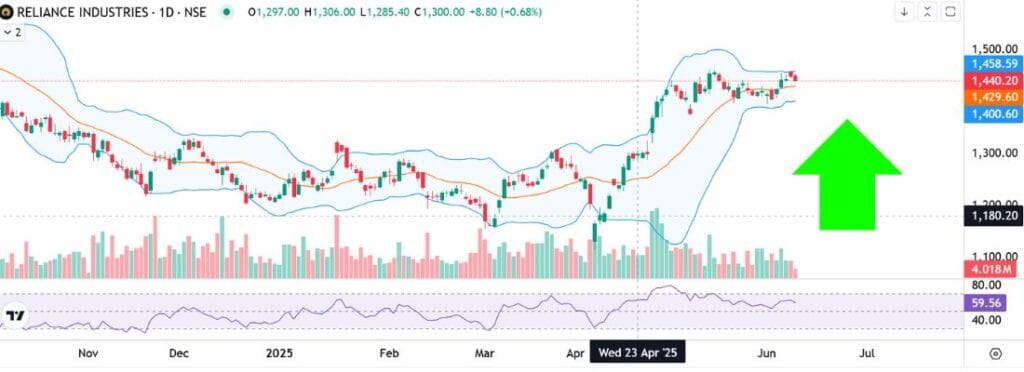
📉 How to Read a Stock Chart Like a Pro
- Identify the Timeframe (Daily, Weekly, Monthly)
- Look for patterns: Is the price going up, down, or sideways?
- Use Indicators: Add RSI, moving averages, and Bollinger Bands.
- Analyze Volume: Strong trends are backed up by strong volume.
🤝 Just starting? Learn how to invest in stocks step-by-step before applying these techniques.
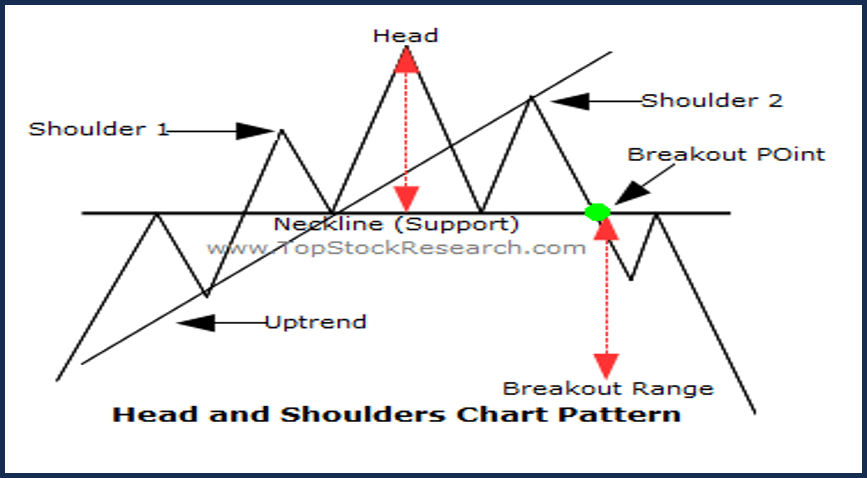
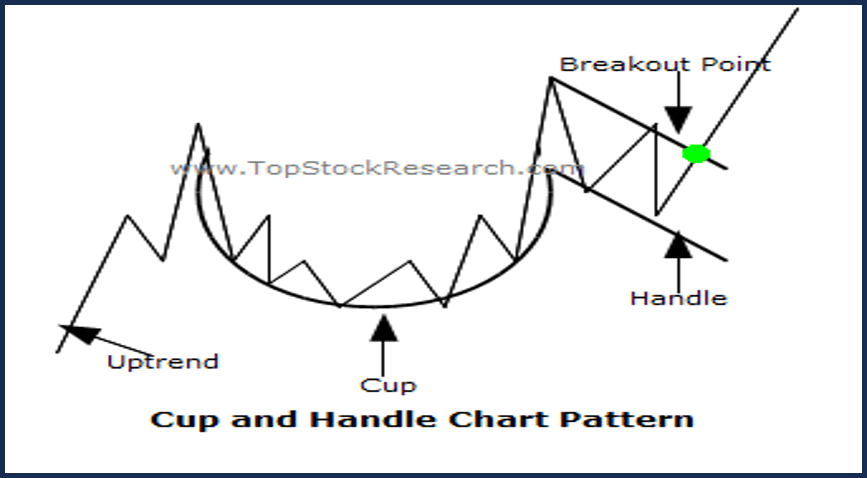
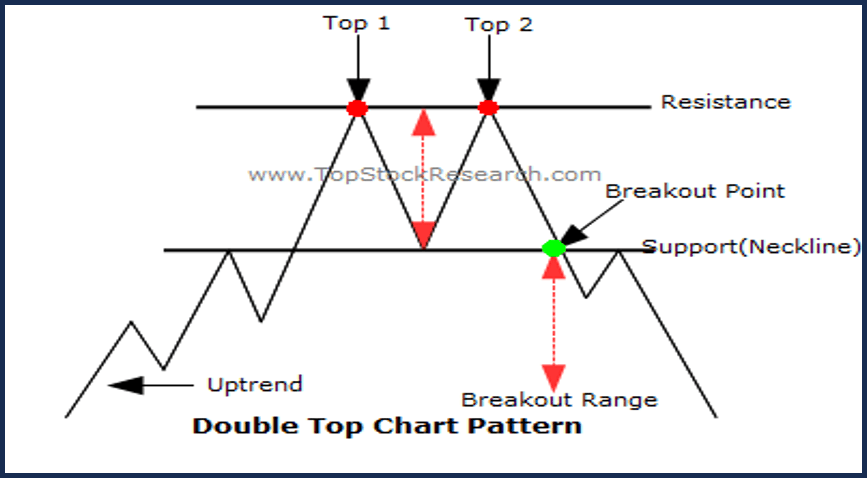
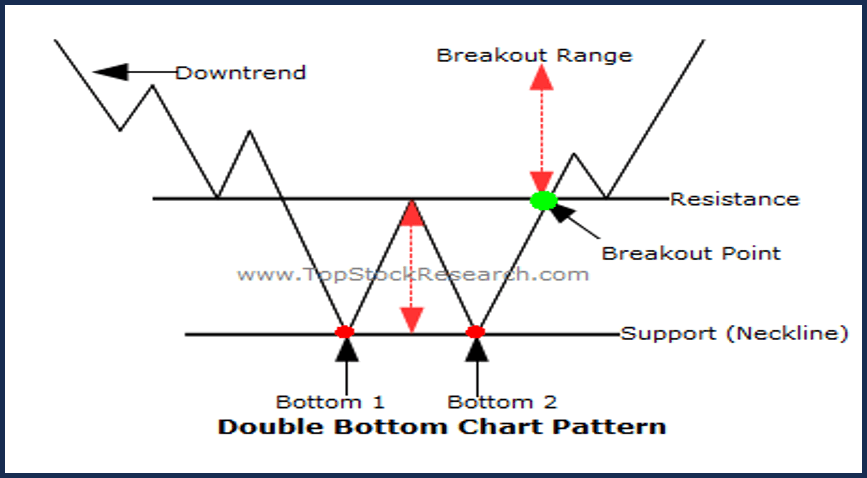
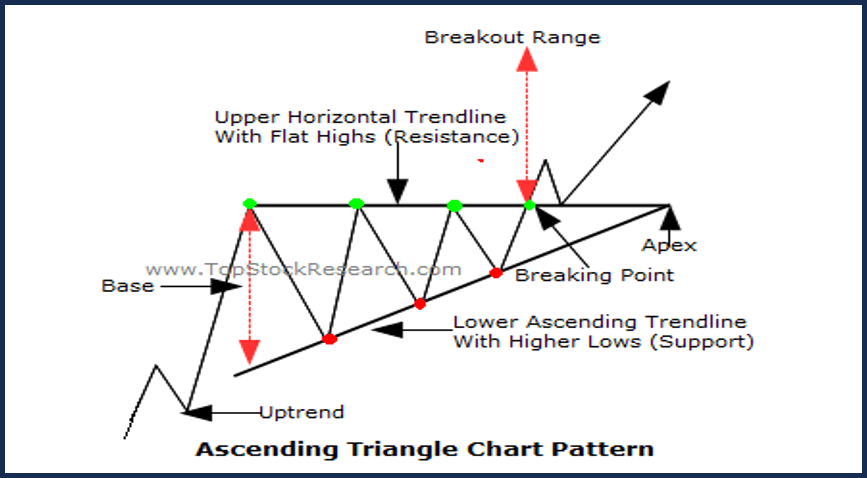
🔄 Important Price Patterns and What They Mean
| Pattern | Meaning | Signal |
|---|---|---|
| Head & Shoulders | Reversal | Bearish |
| Cup & Handle | Continuation | Bullish |
| Double Top/Bottom | Reversal | Depends |
| Ascending Triangle | Breakout | Bullish |
❌ Price Analysis Mistakes ❌
- Not focusing attention to volume signals
- Relying too much on indicators without knowing what they mean
- Getting upset about short-term price changes
- Not setting stop-loss points
📥 Want to buy stocks? Learn to create a free demat account in minutes.
🧪 Real-World Example: Understanding Price Data
Let’s say that Stock ABC shows:
- Moving average over 50 days is going up
- RSI is overbought when it is above 70.
- Volume went up after earnings
Conclusion: The stock is going up, but it might be time for a short-term correction because it is overbought. Now is not the time to buy.
🔗 Useful External Links
✅ Conclusion
There is a lot of power in stock price analysis, but it’s not magic. Add it to good fundamentals, patience, and risk management. Knowing how to read stock prices gives you a big advantage, whether you’re swing trading or building a long-term portfolio. Explore different types of stocks to diversify your analysis across sectors and styles.
⚠️Disclaimer
This blog is only for information and should not be used as financial advice. Before you make any investment decisions, please talk to a certified financial advisor.
❓ FAQs
1. What does it mean to analyze stock prices?
Using historical and current price data, stock price analysis helps investors understand price trends and make smart trading or investing decisions.
2. Which is better, technical or fundamental analysis?
Both are useful. Fundamental analysis helps you choose what to buy, and technical analysis helps you time your entry and exit.
3. Is it possible for beginners to learn how to analyze stock prices?
Of course! Before moving on to more advanced tools, learn how to use basic chart patterns, moving averages, and RSI.
4. What are the best tools for looking at stock prices?
TradingView, Investing.com, and Yahoo Finance all have charting tools that are easy for beginners to use.
5. Where can I find out more?
Check out our guide on What Is Trading? Everything You Need to Know Before You Start.