

Why Support and Resistance Are Important 🎯
Have you ever thought about how professional traders decide when to buy or sell a stock? It’s not just a gut feeling or luck; you need to know what **support and resistance** levels are.
If you know these two simple ideas, you can better time your trades, make fewer emotional decisions, and grow your portfolio with confidence, whether you’re just starting out or have been investing for a long time. These price levels are the **basis of technical analysis**. They help you find market reversals, see trends, and avoid making mistakes that cost you money.
We’ll explain what support and resistance are, why they’re important, and how to use them in a way that’s “simple, practical, and relevant to everyone” in this guide.
Let’s open the door to smarter investing.
Table of Contents
📈 What Are Support and Resistance?
A stock’s “support” level is the price at which it usually stops going down and starts going back up.
**Resistance** is the point at which the price usually stops going up and starts going down.
You could say that they are like “invisible floors and ceilings” in the market. These levels happen because of how prices have changed in the past, the balance of supply and demand, and how traders think.
If a stock keeps bouncing back from ₹100, that ₹100 becomes a “support.” If it can’t get past ₹120 a few times, ₹120 becomes the “resistance.”
🧠 Why They Work: The Psychology Behind Price Levels
Support and resistance are not “magic lines.” They show how people act and how the market thinks:
- Support shows buyer confidence: Buyers see value at lower levels.
- Resistance shows fear or profit-taking: Sellers come in at higher prices.
- Historical memory: Traders remember how things went in the past and act accordingly.
📌 **Tip:** For better results, use support/resistance and trend direction together.
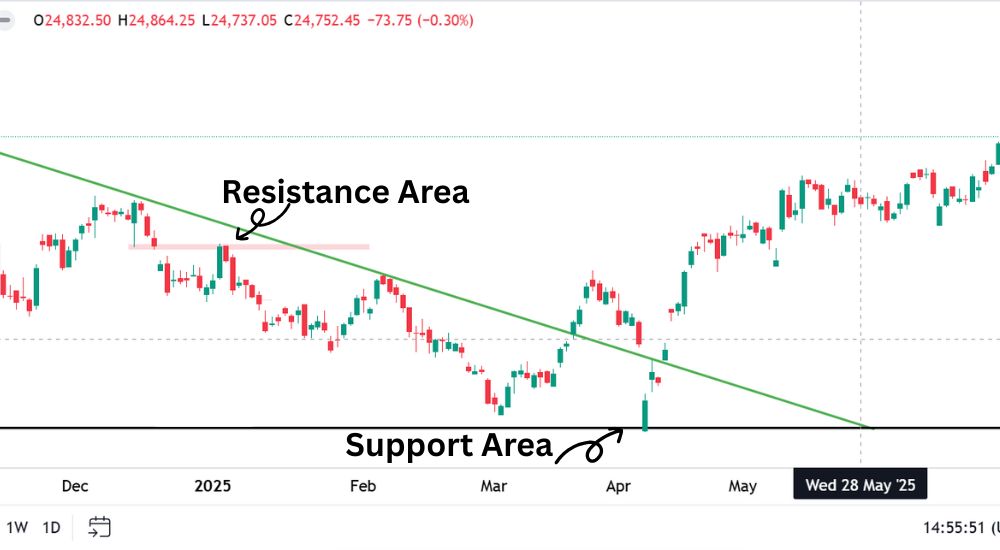
🔍 How to Identify Support and Resistance Zones
📊 Historical price charts: Look for patterns of highs and lows.
📉 Trendlines: Connect several swing highs and lows with lines.
📏 Moving averages: These are often support and resistance that changes over time.
🔄 Round numbers: Stocks often move when they are close to whole numbers like $50 or $100.
🛠Example: We talk about how important these zones are for making decisions in this guide on [Stock Price Analysis]
🧭 Key Strategies Using Support and Resistance
✅ Breakout Trading
Wait for price to break resistance or support with strong volume. Trade in the direction of the breakout.
✅ Bounce Trading
Buy at support, sell at resistance. This works well in sideways or range-bound markets.
✅ Stop-Loss Placement
Place stops just below support (when buying) or above resistance (when shorting) to manage risk.
🛠 Tools & Indicators That Help
🔧 Use these tools to enhance accuracy:
- Fibonacci Retracement
- Moving Averages (50/200-day)
- Relative Strength Index (RSI)
- Volume analysis
Platforms like TradingView, Investing.com, or Dhan App (see how to create a free demat account) offer these tools.
🌍 Real-World Examples and Case Study
📌 Case Study: Reliance Industries
Between ₹2400–₹2500 acted as strong resistance in 2023. After breaking out with volume, the stock surged to ₹2700+.
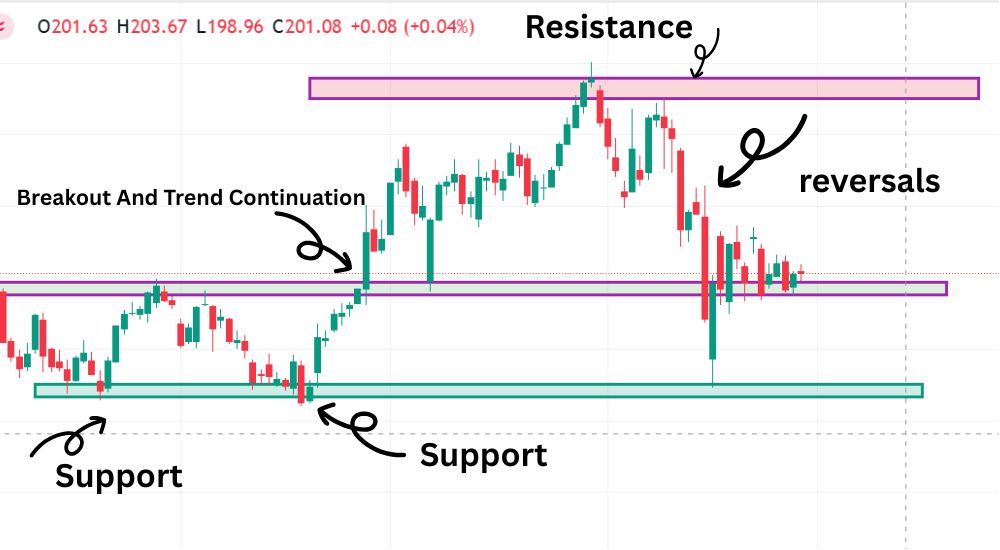
📌 Global Example: Tesla Inc. (NASDAQ: TSLA)
$200 acted as a psychological support zone during volatile sessions in early 2024.
Use sites like Yahoo Finance, MarketWatch, or NSE India to monitor zones in real time.
Apple Chart:
⚠️ Common Mistakes to Avoid
🚫 Assuming levels are exact (they’re zones, not exact lines)
🚫 Trading without confirmation (wait for volume or candle close)
🚫 Ignoring the broader trend
🚫 Overcomplicating with too many lines
🧩 Support & Resistance vs Other Market Concepts
| Concept | Focus | Use With S&R? |
|---|---|---|
| Trendlines | Price Direction | ✅ Yes |
| Indicators | Momentum | ✅ Yes |
| News/Events | Sentiment | ⚠️ Use cautiously |
| Moving Averages | Smoothing data | ✅ Very helpful |
Explore more in our article Mastering Stock Market Fundamentals for Long-Term Wealth.
✅ Actionable Takeaways
✔️ Mark zones, not lines
✔️ Use volume and candle patterns for confirmation
✔️ Combine with trend direction
✔️ Keep your strategy simple and consistent
✔️ Always use a stop-loss
🔚 Conclusion & Final Thoughts
Support and resistance are simple but powerful tools that can make a big difference in how well you time the market. When used with discipline, they tell you exactly when to buy and sell, protect your money, and help you grow your portfolio with confidence.
Take the time to learn how to spot zones and include them in your trading plan. With time, you’ll get clearer, more confident, and better results
⚠️ Disclaimer: This article is for educational purposes only. Trading involves risk, and past performance is not indicative of future results. Please do your own research or consult a financial advisor before making investment decisions.
❓ FAQ – Support and Resistance
1. Can support and resistance be used in all timeframes?
Yes! They work well on daily, weekly, and even intraday charts.
2. Are support and resistance only used in technical analysis?
Yes, for the most part, but fundamental traders also use these zones to figure out when to trade.
3. How reliable are these levels?
They are very reliable when confirmed with volume and patterns, but no strategy is 100% foolproof.
4. Can AI or algorithms detect support and resistance?
Yes, a lot of trading bots and platforms use past data to find zones.